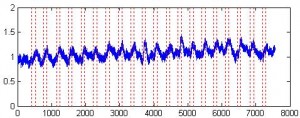
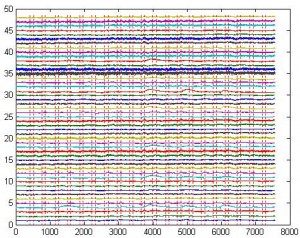
1. plotTraces, plot a time series, or multiple time series on one plot, with vertical lines indicating the markers (events). Can be used for data quality check and global signal detection.
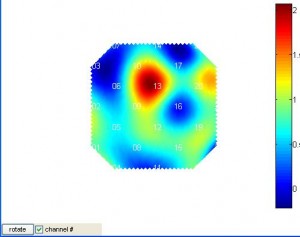
2. plotTopoMap, plot a map of activation.
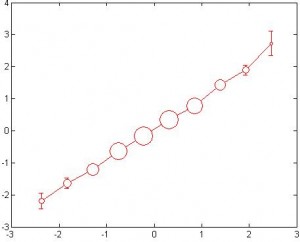
3. plot2, scatter plot, circle area proportional to sample size
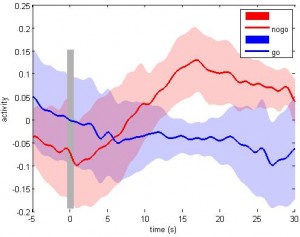
4. plotAverage, plot average time courses over trials with standard error



Dear Xu,
are these functions from some toolbox?
They are some functions I wrote. Not publicly released yet.
How did you create those areas of standard error on the plotAverage plot?
@Andrew
fillhandle=fill(xpoints,filled,colors(ii,:));%plot the data
set(fillhandle,’EdgeColor’,[1 1 1],’FaceAlpha’,0.2,’EdgeAlpha’,0);%set edge color
I downloaded topo.m for nirs data mapping. Sample data works very well. however what I modified and saved as test.csv using “openoffice” or “ms-office-excel” which doesn’t load in topo.m
what should I save as the file to use topo.m ?
thanks in advanced.
@baku
I find similar problem – sometimes modified csv can’t be read. You may want to try to open the csv file using a plain text editor and see what happens.
@Xu Cui
thanks to rapid reply. I tried it in emacs save as plain text format(.txt) but there wasn’t any improvement. Everything is save as just other name topo.m reject to load the modified file which loaded in topo.m … confused and dazed @@