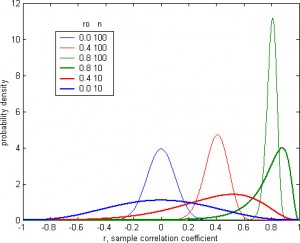
Assume you got correlation r=0.6 between two variables (N=10), is 0.6 significantly bigger than 0? Or if you observed r=0.98, is it significantly different from r=0.9? For these questions, we need to know the distribution of r of our sample, given the population correlation coefficient ro (i.e. the “true” correlation coefficient) and sample size n.
This distribution is complicated:

For more info, you can find from the link at the bottom. But let’s plot some distributions for different ro and n:
As you can see from the blue curves, if our sample size is 10 (small), a big correlation like 0.4 could be purely by chance and thus is not significant; but if the sample size is 100, a 0.4 correlation is significant and trustworthy.
You can simply calculate the area under the distribution curve to find the p-values.
Link:
http://mathworld.wolfram.com/CorrelationCoefficientBivariateNormalDistribution.html
MatLab code for the distribution:
function y = corrdist(r, ro, n)

y = (n-2) * gamma(n-1) * (1-ro^2)^((n-1)/2) * (1-r.^2).^((n-4)/2);
y = y./ (sqrt(2*pi) * gamma(n-1/2) * (1-ro*r).^(n-3/2));
y = y.* (1+ 1/4*(ro*r+1)/(2*n-1) + 9/16*(ro*r+1).^2 / (2*n-1)/(2*n+1));


I used you code to construct an R function that does the same task and illustrated its use at Stats StackaExchange:
http://stats.stackexchange.com/questions/14220/hypothesis-test-that-correlation-is-equal-to-given-value/14224#14224
Thanks, David. You have done a great job!
My kid lot his PhD in math (entropy theory) a year ago at Albany NY, and is still unemployed. Where should he look? It would be nice if he could move to California.
Richard (the engineer)
Thanks for sharing. This was very helpfull.