In a recent fNIRS journal club (vedio recorded here), Dr. Tong talked about their work on the phase difference between oxy and deoxy Hb, and its relationship with participants’ age. This article is a demo of how to use Hilbert transform to calculate the phase difference between two signals, and whether it’s valid if the signals contain a wide range of frequencies.
Tool: We use MatLab’s hilbert function to calculate the instant phase of a signal. The code can be found in the end of this article.
Case 1: single frequency
Here we tried the simplest case: x and y are single frequency signals with phase difference pi/2, as demonstrated in the figure below. We expect that the calculated phase difference is close to pi/2 or 1.57.
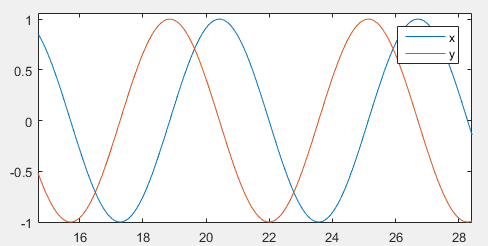
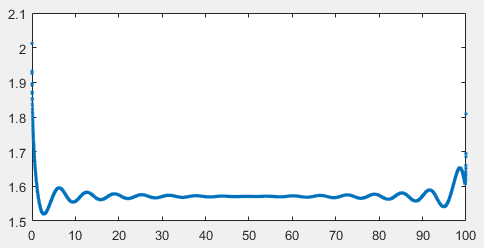
As expected, the phase difference is pi/2! Hilbert transform is doing well in picking up the phase difference! It is noted, however, the calculation is more robust in the middle of the signal.
Case 2: 2 frequencies
What about more complex signals? If x and y both contains two frequencies, each with phase difference pi/2, will Hilbert transform find the correct value?
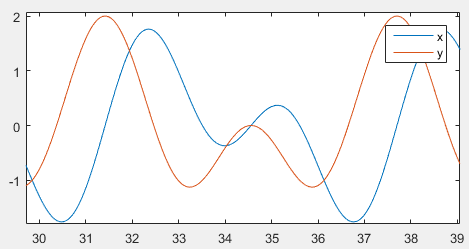
Yes. It turns out Hilbert transform works for two-frequency signals as well.
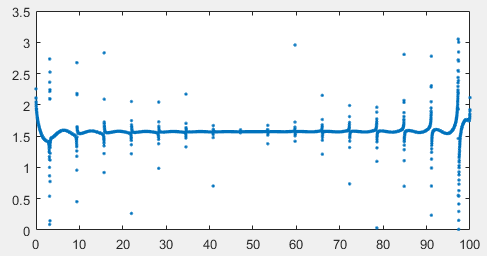
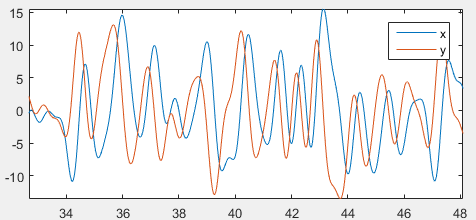
Case 3: a lot of frequencies
In this case we generated x and y each with 50 random frequencies. The resulted signals are essentially random:
Again, Hilbert transform found the correct phase difference, pi/2:
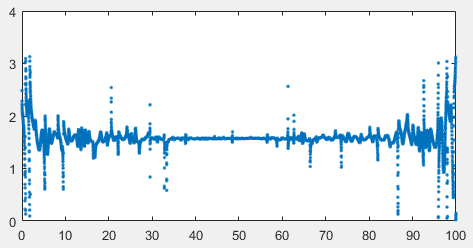
People may argue that in such a wide-band case the “phase difference” is not meaningful. However, if the phase difference for each frequency is similar, then it is reasonable to say that the phase difference between the overall signals exists and is that value.
Code (MatLab)
Update: in the original version I shift phase manually (and contains an error!). Now we use unwrap and wrapToPi, suggested by Yafeng Pan, which is easier to use and produce the correct phase shift. Thank Yafeng!
% Demo of Hilbert transform to calculate phase difference between two
% signals
% Xu Cui 2021/6/7

% single frequency
t = [0:0.01:100];
x = sin(t);
y = sin(t+pi/2);
figure; plot(t, x, t, y);
legend('x','y');

xh = hilbert(x);
yh = hilbert(y);

xphase = unwrap(angle(xh));
yphase = unwrap(angle(yh));

figure; plot(t, xphase, t, yphase,'.');

phase_diff = wrapToPi(xphase-yphase);
figure; plot(t, phase_diff, '.');

% 2 frequencies
t = [0:0.01:100];
x = sin(t) + sin(2*t);
y = sin(t+pi/2) + sin(2*t+pi/2);
figure; plot(t, x, t, y);
legend('x','y');

xh = hilbert(x);
yh = hilbert(y);

xphase = unwrap(angle(xh));
yphase = unwrap(angle(yh));

figure; plot(t, xphase, t, yphase,'.');

phase_diff = wrapToPi(xphase-yphase);
figure; plot(t, phase_diff, '.');

% a lot of frequencies
t = [0:0.01:100];
x = zeros(size(t));
y = zeros(size(t));
frequency = rand(1,50)*10;
for ii=1:length(frequency)
    f = frequency(ii);
    x = x + sin(f*t);
    y = y + sin(f*t+pi/2);
end

figure; plot(t, x, t, y);
legend('x','y');

xh = hilbert(x);
yh = hilbert(y);

xphase = unwrap(angle(xh));
yphase = unwrap(angle(yh));

figure; plot(t, xphase, t, yphase,'.');

phase_diff = wrapToPi(xphase-yphase);
figure; plot(t, phase_diff, '.');
写作助手,把中式英语变成专业英文

AI writing papers with real references

Many thanks for sharing this useful program for finding phase shift. I appreciate it.