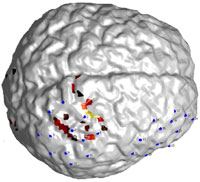
This is an example of brain activation plotted on surface. In many circumstances surface view is much more straightforward than a slice view. Here is how I created such a plot using MatLab and SPM.
Environment and Tools:
- Windows XP
- MatLab (v7.6)
- SPM (v8)
Step 1. Generate “faces” and “vertices” of the surface using SPM
If you prefer to use SPM’s interface, launch SPM, then click “Render …” box and click “Xtract surface”. You are asked to input an image file. Select an image file and press Done. Select “Save Extracted Surface” and a few seconds later you will find a file called “surf_???.mat” saved in the current directory. Load this mat file and you will find two variables, faces and vertices. These two variables will be used in the future steps.
If you prefer to use command line, you can simple call function
spm_surf(‘xxx.img’, threshold)
About the input image: If you want to plot surface of brain, you should use a segmentation tool (such as FSL) to get the gray matter image, and use this image as input to spm_surf. If you want to plot the surface of skull, you can input the original structural image but with careful choice of threshold.
Step 2. Plot the surface
Plot using MatLab’s patch function. Here is a sample code
p=patch(‘faces’,faces,’vertices’,vertices, ‘facecolor’, ‘flat’, ‘edgecolor’, ‘none’, ‘facealpha’, 1);
facecolor = repmat([1 1 1], length(faces), 1);
set(p,’FaceVertexCData’,facecolor);daspect([1 1 1])
view(3); axis tight
view([50 -40 100])
camlight
lighting gouraud
Step 3. Overlay a functional image
The strategy here is that you first get the coordinates of the activated voxels and the corresponding colors you want to use for each voxel (presumablly dependent on the intensity of each voxel). Then find the vertices and faces that are “close” to the coordinates, and change the face color.
a. get coordinates
v = spm_vol(imagefile); % functional image file
m = spm_read_vols(v);
pos = find(m>=threshold);[xyzcor(:,1) xyzcor(:,2) xyzcor(:,3)] = ind2sub(size(m), pos);
xyz = cor2mni(xyzcor, v.mat);
intensity = m(pos);
b. convert intensity to color
tmp = hot; % using ‘hot’ color scheme
mx = max(intensity);
mn = min(intensity);
intensity = round((intensity – mn)/(mx – mn) * 63 + 1);
colors = tmp(intensity,:);
c. plot
distanceThreshold = 2;
p=patch(‘faces’,faces,’vertices’,vertices, ‘facecolor’, ‘flat’, ‘edgecolor’, ‘none’, ‘facealpha’, 1);
facecolor = repmat([1 1 1], length(faces), 1);
pos = [];
for ii=1:size(xyz, 1)
tmp = find(abs(vertices(:,1) – xyz(ii, 1)) <= distanceThreshold & abs(vertices(:,2) – xyz(ii, 2)) <= distanceThreshold & abs(vertices(:,3) – xyz(ii, 3)) <= distanceThreshold );
pos = [tmp];
posf = find(sum(ismember(faces, pos),2)>0);
facecolor(posf,:) = repmat(colors(ii,:), length(posf), 1);
endset(p,’FaceVertexCData’,facecolor);
daspect([1 1 1])
view(3); axis tight
view([50 -40 100])
camlight
lighting gouraud


thanks for your information. very usefule. But, what’s the function of cor2mni? Is it a spm function or your private one??
cor2mni.m can be found at:
http://www.alivelearn.net/?p=1101
thanks, this is very useful. do you know of any way to cut away parts of the surface, as it is shown in the last picture in this example by mathworks: http://www.mathworks.com/help/techdoc/visualize/f5-3291.html using your method?
@max
I have no idea. Please let me know if you find a way.
Dear Prof. Cui,
Thanks for your information. When I use SPM to save extract surface, there is only a file named *.surf.gii,
not the surf_???.mat file. Could you tell me why
I can’t get the .mat file? Is there any mistakes with me?
thanks
shuixia
@shuixia
Shuixia,
I am not sure what happens. Did you try the command line method?
Xu
Dear xu cui
thank for usefull informations,i have a 144 jpg brain slices and i managed to reconstruct them into 3d VOLUME using isosurface and patch commands of matlab.now i want display only the 3d surface of this volume using only matlab.wish to hear from u.
@AKRAM
You mean without SPM? I am not sure how to do it.
Hello Mr Chu, I am new in matlab and SVM coding. Please I want to know how I can obtain the frequency, Scale, Phase etc parameters from Matching Pursuit and Gammatonne Frequency Cepstral Coefficient algorithms in order to detect and recognize environmental sound. Thank you very much as I await your response
Dear Mr Cui, I am new in matlab and SVM coding. Please I want to know how I can obtain the frequency, Scale, Phase etc parameters from Matching Pursuit and Gammatonne Frequency Cepstral Coefficient algorithms in order to feed them into the SVM classifier to detect and recognize environmental sound. Thank you very much as I await your response
@Rosemary
Rosemary, while I want to help, I am not in your field and have no idea what “Matching Pursuit and Gammatonne Frequency Cepstral Coefficient” are.
@shuixia
me too, did you manage to get the sphere.mat? i only get the .gii or the choise render which give 6 matrices? any help please?