Handy programs to visualize NIRS data (1): plotTraces

26 sec read

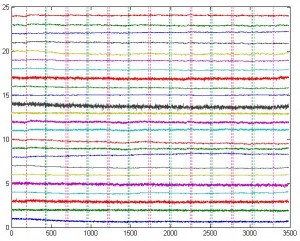
You often need to plot the time series of NIRS signal from all channels with event indicators (See the example below). plotTraces can do that easily.
plotTraces
plotTraces

In the above example, time series of all 24 channels are plotted. The number on the y-axis indicates the channel number, and the vertical lines indicate events. Each color represents one event.

Here is an example of using this function:

figure;plotTraces(hbo, 1:24, mark);

where hbo is Nxm matrix (N: # of time points; m: # of channels). mark is a nx2 matrix where the 1st column is event type (1, 2, 3, …) and the 2nd column is the timing of each event.

And here is the source code of the function.
plotTraces.m


文献鸟 618 活动


写作助手,把中式英语变成专业英文


Want to receive new post notification? 有新文章通知我

第六十三期fNIRS Journal Club视频 张百强

Youtube: https://youtu.be/vBsdcx08ZV4 优酷:https://v.youku.com/video?vid=XNjQ4NTcxNjM4MA%3D%3D fNIRS信号
Wanling Zhu
13 sec read

第六十三期fNIRS Journal Club通知2025/6/14, 10am 张百强

该文章的声音简介(中文版): 该文章的声音简介(英文版): fNIRS信号容易受到头动伪影、接触不良以及生理噪声等影响,导致测量信号信噪比低和数据浪费。来自北京师范大学牛海晶课题组的张百强同学将分享一
Wanling Zhu
9 sec read

第六十二期fNIRS Journal Club视频 李杨卓博士

Youtube: https://youtu.be/RN0mUjUe99A 优酷:https://v.youku.com/video?vid=XNjQ3MzIyMTA1Ng== 说服是促进信息传播、人
Wanling Zhu
9 sec read

One Reply to “Handy programs to visualize NIRS data (1): plotTraces”

Leave a Reply to Xin Zhang Cancel reply

Your email address will not be published. Required fields are marked *