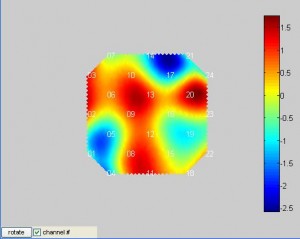
Often you need to view the spatial pattern of activation as in the example below. plotTopoMap allows you to do that. It probably only works for Hitachi devices where the spatial relationship between channels are known.

In the above example, the activation pattern of a 24-channel patch is plotted. The white number indicates the channel number. Color indicates the signal intensity. This map is smoothed. You can immediately tell that what areas are activated. You can also rotate the patch in case the orientation is not correct. You can also hide the channel numbers.
Here is an example on how to use this function:
figure; plotTopoMap(randn(24,1),'4x4');
The 2nd parameter is the patch configuration. It can be ‘4×4’, ‘3×11’, ‘3×5’ or ‘3×3’.
And here is the source code of the function.
plotTopoMap.m. Type help plotTopoMap in MatLab to see how to use it.
Note. This script is adopted from the topo program made by Hitachi.


