
This is the 6th post of the series: Handy programs to visualize NIRS data
When we do an experiment, we often repeat an event (or block) for a few times. For example, in a typical finger tapping task, we ask the participants to do a finger tapping for 20s, then rest for 20s, then repeat the whole tap-rest paradigm for 10 time.
After we extract the NIRS time courses, we often need to know the average of the signal over all repetitions of the event. In the finger tapping experiment, we want to know the average signal across 10 blocks of finger tapping.
What we need to do is:
- Know the timing of each block (of course!)
- cut the NIRS signal into pieces. The starting points should be a few seconds before the onset timing of the experiment block; and the ending points should be a few seconds after the offset of the experiment block.
- Align the pieces and average
- Also calculate the standard deviation (or error) of the average
- plot
The attached cuixuNIRSretrieve.m and plotAverage can automatically do the above steps. Below is a plot done by plotAverage. In this example, there are two types of events, fs and fb. Each was repeated 10 times. The plot below plot the average of each of the event, and also the standard deviation (the shaded area). The vertical grey bar is the onset timing of the events. From the plot we can see that fb elicits a bigger response than fs does.
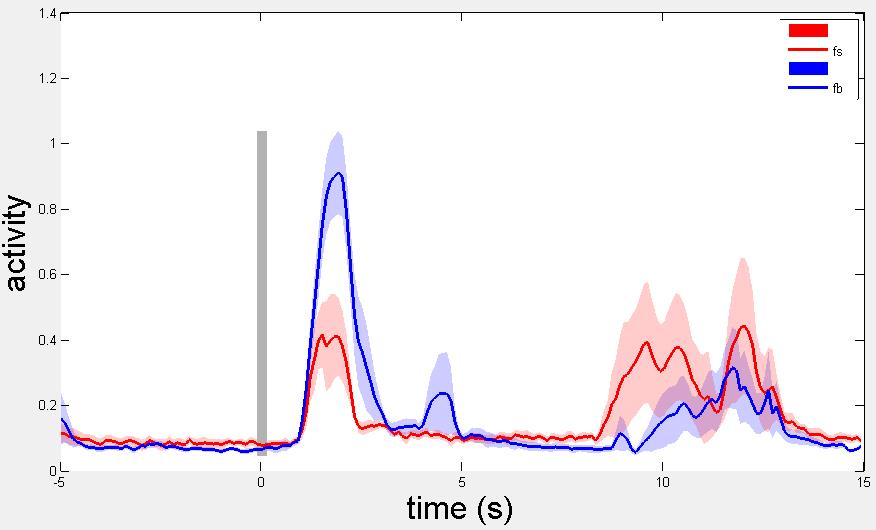
- plotAverage
You can download the two scripts at:

写作助手,把中式英语变成专业英文
AI writing papers with real references


you are a great man!
Hi Cui,
Thanks for your generous contribution, I am just wondering if the normal hyspectral camera can take pictures inside potatos
Any external light can penetrate the potato body(tub)?
Thanks lot , if you can provide some confirmation.
regards,
Dom
Hi Xu
We would like to use your scripts to average and plot NIRS data.
Do you may have sample data to test it? I am especially not sure how the eventOnset (structure, the onset time (in seconds) of event) should look like.
many thanks in advance
lisa
@Lisa Holper
Lisa,
You can find a sample data set at: http://www.alivelearn.net/sample-nirs-finger-tapping-data/
As to eventOnset, an example would be:
eventOnset.tap = [10 30 50 70];
eventOnset.beep = [20 40 60 80];
I made up the numbers and event names, but you get the idea.
@Xu Cui
Hi Xu, I can’t open the link above. Can you send the example of data again?
I am in doubt whether the data is the output of NirsLAB block average since the signal event specifies a column vector, but I have been exporting Oxy and Deoxy which results a text document with two columns. Additionally, the time onset differs from participant from another as my finger tapping blocks were randomized, should I create eventOnset for each participant?
kind regards,
Artur