Picture:
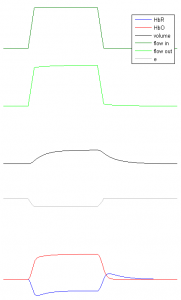
The vascular bed is treated as an expandable venous compartment (a balloon). If there is a burst of flow, the volume will increase and then return to baseline. That’s where ‘balloon’ comes from.
During steady state (i.e. without activation), the flow into the bed and the flow out the bed are balanced. The in flow is assumed to be pure HbO (oxygenated Hemoglobin). HbO converts to HbR at rate E0. E0 is usually 0.4. Volume, HbO and HbR are all at baseline (assumed to be 1).
When the in flow increases (due to neural activation), the volume increases due to the inbalance of in flow and out flow. The in flow is the driving force and the entire time course of in flow has to be specified as the input. Usually it’s modeled as a trapezoidal function. The out flow is a function of volume.
The oxygen extraction fraction E (the rate at which HbO converts to HbR) is a function of in flow. The more in flow, the less E. At baseline, E is usaually 0.4. If in flow is infinitely big, E will be 0. So during the burst of in flow, E will decrease and then return to baseline. As a result, HbR will decrease initially, then increase and overshoot, finally reachs baseline. HbO dynamics is simple, increase, then decrease.

$$\frac{dq}{dt}=\frac{1}{\tau_0}[f_{in}\frac{E}{E_0}-f_{out}\frac{q}{v}]$$
$$\frac{dv}{dt}=\frac{1}{\tau_0}[f_{in}-f_{out}]$$
$$E=1-(1-E_0)^{1/f_{in}}$$
$$f_{out}(v)=\frac{1}{1+\frac{\tau_0}{\tau_v}}(\frac{\tau_0}{\tau_v} v^{1/\alpha}+f_{in})$$
The change of HbO (i.e. oxygenated Hb) is
$$\frac{dp}{dt}=\frac{1}{\tau_0}[f_{in}-f_{out}\frac{p}{v}]$$
which is simply
$$p = v-q$$
I have matlab scripts of balloon model:1. balloon.m 2. balloon_ode.m
Please refer to the original paper:
Buxton et al (1998) Dynamics of blood flow and oxygenation changes during brain activation: the balloon model. Magnetic resonance in medicine 39 (6) 855-64


Hi, can you send me your matlab script for balloon model? Thank you.
Martin
i can not use your code…
?? Error using ==> plot
Bad property value found.
Object Name : line
Property Name : ‘Color’.
Error in ==> plotTraces at 33
h=plot(time,
signal(:,channel(ii)),’color’,traceColors(ii,:));
Error in ==> Balloon_Model at 99
plotTraces([hbo’-0.5 hbr’]*2, [1 2], stimTime*10,
‘rbk’);
can you help me?
🙂
Hi Cui, I just discovered your website, really nice.
Have you ever extended your balloon model script to create the full hemodynamic model (including flow change as function of stimulus input, as used in Dynamic Causal Modelling by Friston&Stephan)?
I would like to play around with this model but cannot find a matlab script anywhere….
@Felix
I have not unfortunately.
hello Mr Cui
I run your code , but please see this error :
Error in Ballon (line 99)
plotTraces([hbo’-0.5 hbr’]*2, [1 2], stimTime*10, ‘rbk’);
“plotTraces” is a function that you developed?
how about “runningCorrelation”?