
NIRS hyperscanning data analysis (1)
NIRS hyperscanning data analysis (2)
NIRS hyperscanning data analysis (3)
NIRS hyperscanning data analysis (4)
How do we analyze hyperscanning data to find out the relationship between two brains? Obviously correlation is the first thought. However, raw correlation analysis might be susceptible to noise in the data (e.g. physiological noise such as heart beating, or motion noise). Wavelet coherence is a great way to find correlation between two signals – at the same time not affected by physiological noises. To understand wavelet coherence, you might want to read:
Let’s look at the data of a pair of subjects (please click the image to zoom):
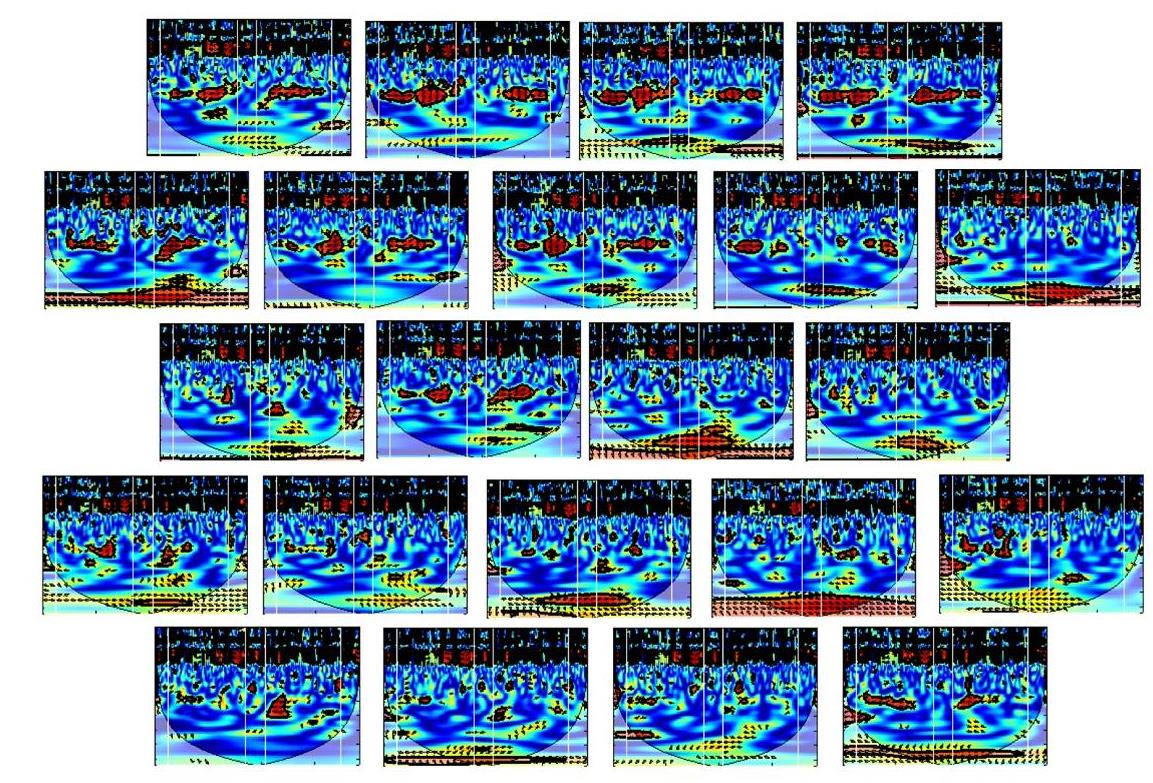
There are 22 channels in total in each participant. Each small plot in the figure above is for one channel. The plots are arranged following the real position of the channel on the participant’s head. How did I arrange them? I cut and paste and arrange in PowerPoint 🙂 You can imagine it took me some time. I wish there is a handy tool.
By looking at this figure, a pattern pops out – there is a band in the period 6.4s in multiple channels. Maybe this band (increase of coherence) is a signature of collaboration. To quantify this, we average the coherence value around the band (between periods 3.2 and 12.8s in the task block, and the rest period in between):
[Rsq,period,scale,coi,sig95] = wtc(signal1,signal2,'mcc',0, 'ms',128);
period32 = find(period>32);
period32 = period32(1);
b1 = mean(mean(Rsq(period32:end, marktime(1):marktime(2))));
bi = mean(mean(Rsq(period32:end, marktime(2):marktime(3))));
b2 = mean(mean(Rsq(period32:end, marktime(3):marktime(4))));
Now we get a 3 values for each channel. I normally define “coherence increase” as the average of the coherence during task minus the coherence in rest. So CI = (b1+b2)/2 – bi
For each channel in each subject pair, we got a single value (CI). Then for each channel, we can do a group analysis using T-test. After we get all the T-values for all channels, then we can plot the map using plotTopoMap
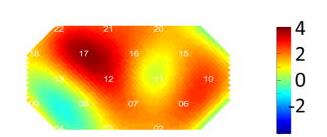
This is basic analysis. You can go much deeper from here. Below are some examples:
- Is there a learning effect? i.e. is the performance during the 2nd block better than the 1st block? Is the coherence increase higher than the 1st block?
- Does coherence increase in the collaboration block differ from other blocks (such as competition, independent blocks)?
- Does the phase of the coherence carry any information?
- …

写作助手,把中式英语变成专业英文
AI writing papers with real references



Dear Dr.Cui:
I am little confused about the formual” b1 = mean(mean(Rsq(period32:end, marktime(1):marktime(2))))”,especiall the period32:end.
In the context, you said the period between 3.2-12.8(32-128) was your instrested, so if you want to extra the correlation value of that band, the formal is Rsq(period32:period128, marktime(1):marktime(2)), right?
The ‘ms’ argument in the previous line specified the max period.
@Xu Cui
sorry for miss this key point!!
Thanks a lot!!
Hi Prof. Cui,
I’m trying to add support for 3×10 to plotTopoMap.
In plotTopoMap.m, during testing of my new version, I’ve found m(10,2:3) and m(4,12) miscomputed (divided by a wrong number). Maybe your team (if not done yet) would like to program it in an more efficient way:) It really took me several hours to read and understand and generate a new one>_< Haha!
best,
Sam