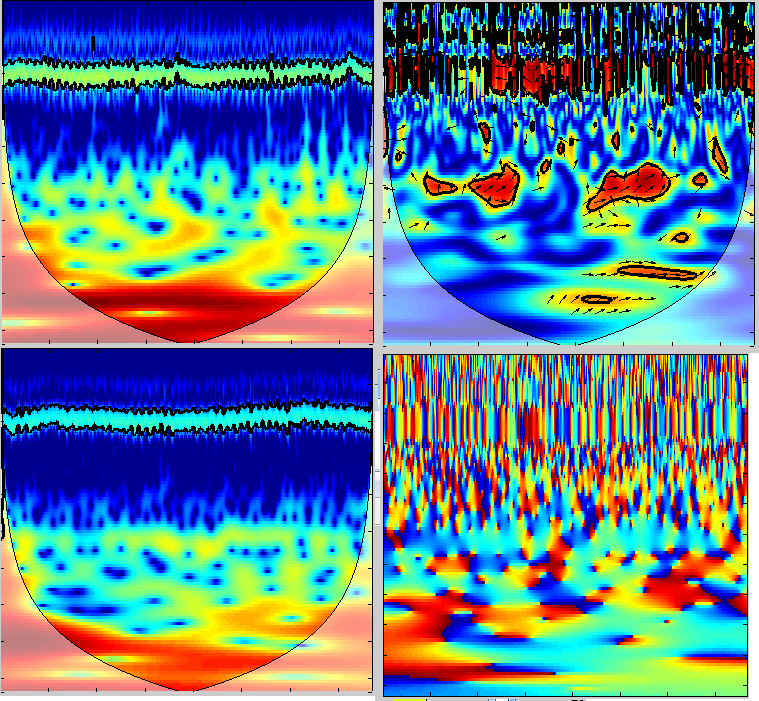
Wavelet toolbox is a useful tool to study hyperscanning data. Many recent publications on NIRS hyperscanning use wavelet coherence to quantify the relationship between two interacting brains (e.g. Baker et al 2016, Nozawa et al 2016). You can see more information about wavelet coherence at https://www.alivelearn.net/?p=1169

Here are some tips to use the toolbox:
1. It often takes a long time to run Monte Carlo simulation. You may use ‘mcc’=0 to disable it.
figure;wtc(signal(:,jj),signal(:,jj+22),'mcc',0);
2. If you need to get the values of the result (instead of the graphic), you may specify the return value
[Rsq,period,scale,coi,sig95] = wtc(signal1,signal2,'mcc',0); %Rsq is a complex matrix
3. If you are only interested in a certain band, you can specify the MaxScale (i.e. ms) parameter. More information at https://www.alivelearn.net/?p=1518
[Rsq,period,scale,coi,sig95] = wtc(signal1,signal2,'mcc',0, 'ms', 128);
4. If you are interested in finding the “phase” information (visualized by the arrows), you may use xwt function. The returned value is a complex matrix and you can calculate the phase.
[Rsq,period,scale,coi,sig95] = xwt(signal(:,jj),signal(:,jj+22));
figure;imagesc(angle(Rsq));
5. To visualize the power of a single signal, you may use wt, which I personally feel much better than FFT.
figure;wt(signal(:,jj));
6. To change the density of the arrows, you may specify the ArrowDensity parameter
figure;wtc(signal(:,jj),signal(:,jj+22),'mcc',0,'ArrowDensity',[30 30]);
Do you have any tips? Please let me know.


Dear Cui,
Thanks a lot for your post.
Nevertheless it is not clear to me why we must extract the phases on the cross-correlation and not on the coherence whereas this one is present in the figure. Could you explain ? And then, il web want to extract not only the mean but the dynamic (fluctuation) over time, Is there a solution other than compute a loop?
Thanks a lot !
Hi Dr. Xu,
Thanks so much for sharing all this info on your site! I was hoping to get your insight on an analysis decision with WTC: in your 2012 paper, you analyzed the coherence band at period=64 because there was good reason to think that the activity pattern would be at that frequency (task timing = 7s). What would you suggest for hyperscanning studies that aren’t event related, and are instead one long scanning period over the entirety of the subjects’ interaction? Is there any theory about which frequency band is most important in that case, or is the best option just to average the coherence value over a large frequency band?
Thanks so much!
@Shannon
It’s a good question, and a difficult question! Let me share briefly with you the thought behind the band choice:
When I was doing data analysis and saw the coherence figures, there was an obvious red band in the plot. So this is something interesting, I thought. Then I examined its frequency, and found it is at ~7s, which turned out to be our task frequency. So in our paper we wrote we use the coherence value around the task frequency band.
As you see, we discovered the pattern (red band) first, then try to rationalize this pattern (find a reason choose this band). In the paper it sounds we already have a good reason to choose the band in the first place, but the reality is reverse.
So while I can’t answer your question directly, I do encourage you to see if there are any patterns emerging in your figure.
Dear Dr.Cui:
Thanks so much for sharing these ideas,It’s very useful.
Btw. I want to ask you whether there wiil be some differences between the reult figures that one I did Monte Carlo simulation and one did not(‘mcc’=0).
sincerely ,it really cost so much time to do Monte Carlo! =_=
@Jiaxin Yang
mcc is to calculate the significance value. I never used it because our statistics test were on group level.
@Xu Cui
So kind of you, Thanks a lot!