[last updated: 2019/11/20]
Also check out NIRS data analysis (time series)
Environment requirement
- MatLab
- SPM 5 or 8
- xjView 8
xjview can be downloaded for free from https://www.alivelearn.net/xjview/
(If you are inside CIBSR, xjview is located in/fs/fmrihome/fMRItools/Xjview)
Add xjview to path byaddpath(genpath('/fs/fmrihome/fMRItools/Xjview')) nirs2imgfunction in this article can be obtained in the page https://www.alivelearn.net/?p=2230 [Link updated on 2019/10/02] or https://www.alivelearn.net/?p=1574. It is located in the nirs folder.- NFRI toolbox (for standard brain registration)
Download from https://alivelearn.net/20180320_nfri_functions.zip[Link updated on 2021/07/15] and save it in a directory whose name contains no space (e.g. not in something like c:\program files\…).
Preparation
- convert NIRS data file to csv format using ETG4000 program.
- copy the 3D positioning data (00X.pos). If you didn’t measure 3D positioning data, jump to step 5
- use NFRI toolbox (Pepe Dan, Japan. http://www.jichi.ac.jp/brainlab/tools.html) to get the MNI coordinates of each probe. Detailed information on how to use this toolbox can be found in its manual. [Update 2015-07-13. A video tutorial: https://www.alivelearn.net/?p=1726]
- Convert 00?.pos file to csv file using
pos2csv - Convert the 3D positioning data into MNI space coordinate using
nfri_mni_estimation - You will get a xls file containing the positions. There are several sheets in that file and you should use the sheet called “WShatC”, which contains the positions of cortical surface.
- Convert 00?.pos file to csv file using
- Find channel positions based on probe positions using
probe2channel.mDownload probe2channel.m here
probe2channel(probe, config) - If you don’t have 3D positioning data, you may use the template channel positions located in
load xjview/nirs_data_sample/templateMNI.mat
You will find 6 variables in MatLab workspace. They arechannelMNI3x11 channelMNI3x5 channelMNI4x4 probeMNI3x11 probeMNI3x5 probeMNI4x4. They are all Nx3 matrix.
Read data and do GLM
- use
readHitachData.mto read the data file (csv format). Typehelp readHitachDatato see how to use it. Note if your input is two files (for 4×4 and 3×5 configurations), this script will automatically concatenate the data.
[hbo,hbr,mark] = readHitachData({'XC_tap_MES_Probe1.csv','XC_tap_MES_Probe2.csv'}); - Prepare event onset timing, duration etc from the mark data, or external data you have, for later GLM analysis (step 3). The format is:
- onset: onset timing of every event. a cell array. Each element is a numeric vector for one event type. Unit: second
- duration: duration of every event. same with onset, except the meaning of numbers are duration. If the event is punctuated event, use 0 as duration. Unit: second
- modulation (optional): modulation of event. For the same type of event you may have different intensities. For example, your event is flash of 5 levels of intensities. You can use modulation to modulate the intensity. Format is exactly same with onset.
- GLM analysis using glm. Type help glm for more info.
[beta, T, pvalue] = glm(hbdata, onset, duration, modulation); - You may want to save the data for future use.
- (if you want to view the result in a standard brain) Convert the values (T or beta or contrasts) to an image file by
nirs2img. Tryhelp nirs2imgto get more information.
nirs2img(imgFileName, mni, value, doInterp, doXjview)
Visualization
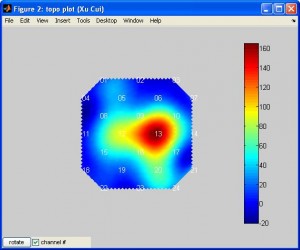
plotTopoMapwill plot data on a plane. The data can be T or beta or other values. Typehelp plotTopoMapfor more info. Here is an example (note the data is smoothed by spline):
plotTopoMap(randn(24,1), '4x4');

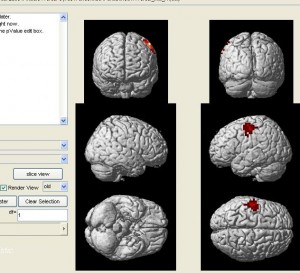
nirs2imgwill convert your data to an image file which can be visuzlied by many fMRI functional image programs (such as xjview). Here is an example of visualizing the image by xjview. Note, after xjview window launches, you need to check “render view”, and then you may choose between new or old style.
nirs2img('nirs_test.img', mni, value, 1, 1);

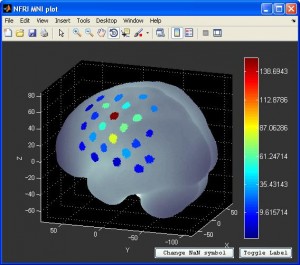
- You can also visualize the result with NFRI’s
nfri_mni_plot(in NFRI toolbox). You need to prepare the the plot data in excel format beforehand. More information can be found in Readme.doc in NFRI toolbox.

Group analysis
- For each individual subject, perform GLM and save the beta values for each condition and subject.
- Do contrast on each subject. Contrasts are simply difference of beta values. For example, contrast between 1st condition and 2nd condition is simply
c = beta(:,1) - beta(:,2);Then save the contrast in an image file usingnirs2imgfor each subject. You get a bunch of contrast images (one for each subject) - Perform T test on the contrast images using
onesampleT.m, or you can use SPM to do one sample T test if you prefer. You will get a T test image file. - Visualize the T test image with xjview (or SPM)


Dear Xu,
I have been reading your writing on NIRS_SPM for a while. Thank you for contributing 🙂
Just a short qns: do you know if there is any Help Forum on NIRS-SPM? I have been trying to use the program but I encountered some annoying errors which I couldnt solve.
Hope you may point me to the right direction. Thanks in advance!
– Lee from Singapore
Hi Xu,
I have been following your writings on NIRS_SPM. Your contribution have been a great help for me.
I have been trying to learn this NIRS_SPM, but it keeps on giving me error. Is there any other material that I can use to learn NIRS_SPM apart from its user manual OR is there any help forum for NIRS_SPM.
Hope to get help from you.
Thanks in advance.
Sabin
I haven’t been using NIRS_SPM for a while. I don’t know if there is any other resources but I do know the authors are very helpful. You might want to contact them directly.
Why can’t find this three function code (glm.m, nirs2img.m, onesampleT.m) in environment requirement your suggestion?
Hi Xu,
I just downloaded the code described in this section and want to play around with an ETG dataset that I did not create position data for. I’m trying to find the template position files that are referenced in:
“If you don’t have 3D positioning data, you may use the template channel positions located in
load xjview/nirs_data_sample/templateMNI.mat”
But I’m having trouble. I don’t have a folder called xjview, just the xjview.m. I can’t seem to find templateMNI.mat. This may be just an issue I’m having w/ matlab, as I haven’t worked with .mat files before. I’ve only worked with .m files. Can you be more specific about how to find these template datafiles? Thanks–I’m really excited to play around with the code you have posted here:)!!
@Leanne Hirshfield
That file is not in the public package of xjview.
An email has been sent to you.
Dear Cui,
Could you send me templateMNI.mat, I am using ETG4000, is this file appropriate for the 3×11 configurations? Thank you!
Can you send me a copy of this three files? glm.m, nirs2img.m, and onesampleT.m. Thank you very much.
Hi Xu,
Could you please also send me the copy of those three files? glm.m, nirs2img.m, and onesampleT.m. Thank you a lot!
@Amy
They are in xjview full version:
http://www.alivelearn.net/?p=1574
Dear Prof Xu,
Could you please also send me the copy of those three files
@vera
They are in xjview full version:
http://www.alivelearn.net/?p=1574
We used “readHitachData”to read files from two probes, but an error appeared:
“Undefined function or variable “timeindex”.
Error in loadHitachiText (line 42)
data(:, timeindex) = timedata;
Error in readHitachData (line 48)
[data, variablename] = loadHitachiText(filenames{fileindex});
Our data have a “Time” column. Could you tell me what are the possibe reasons?
@LiXia Wang
Is your data from Hitachi ETG4000?
@LiXia Wang
Hello, I have this problem, too. The data was collected by ETG-7100. Did you fix it? What’s wrong with this data?
Dear Prof Xu
Hi
could you help me?
i have some datas for nirs. i want to read these datas and use wavelet for processing. i want to know do you have any book or paper that help me how to read data in matlab and use wavelet.
Thank you a lot!
Dear Prof Xu,
Hi,
Thank you sooo much for sharing this Visualization tool of fNIRS.
But I have a problem about the input parameter of nirs2img.
In the 5th step of “Read data and do GLM” process,”(if you want to view the result in a standard brain) Convert the values (T or beta or contrasts) to an image file by nirs2img(imgFileName, mni, value, doInterp, doXjview)”, I don’t know why can beta or contrasts can work and get the P value in xjview. Because NIRS_SPM just use the T to get the P value. Could you please help me understand why beta and contrasts can work?
Thank you so much!!
@Yanchun Zheng
Yanchun, nirs2img is to convert your data (whatever it is) to an image file which can be opened by xjview. It’s does not convert to p-value. In xjview, you can view the image (beta, T, contrast etc). If it’s beta or contrast, then p-value in xjview is meaningless.
Get it! Thank you very much.
Hi I am at the GLM stage and cannot continue because of this erro that I am getting:
[beta, T, pvalue, covb] = glm(hbo, {onset}, {duration});
Undefined function ‘max’ for input arguments of type ‘cell’.
Can you please help me?
Thanks
@Avi
See source code of glm in line 84~ 86, this is where the function ‘max’ appears. You may set a stop point there to see what’s going on there.
Dear Prof. Cui
I have a question concerning following step:
“GLM analysis using glm. Type help glm for more info.[beta, T, pvalue] = glm(hbdata, onset, duration, modulation)”. Shouldn’t we correct the serial correlation for Hb data before we estimate the beta coefficient? Hb data usually shows strong serial correlation after low pass filtering,also considering its relative high sampling rate compared to fMRI.
@Hao Deng
We have not done this step (correct for serial correlation) in the past …
@Xu Cui
Got it. Thanks for your reply.
Hi,Cuixu,
For the nirs2img.funciton. I have a question about “value” in the function.[nirs2img(imgFileName, mni, value, doInterp, doXjview, bilateral) ]
The Note said “value: Nx1 matrix, each row is the value corresponding to mni” , But it sill confunse me a lot.
The value is related with girddata function ? I have try it several time, but still fail…
How should I define this parameter?
@Jiaxin Yang
the ‘mni’ parameter is Nx3 (N points, each point 3D), and value is Nx1 (N points). To start, you can simply use ones as the value. ones(N,1)
Thanks, I got it !! I could also define these value using the t-value or F-value, right? Thanks again for your help.
Hi There Prof. Cui,
Can you please direct me to the probe2channel.m script? Is it in xjView? I cannot seem to find it.
Regards,
Hayden
@Hayden
You may download at: http://www.alivelearn.net/wp-content/uploads/2019/11/probe2channel.m
Hi Xu
Could you please send me the script that includes the ‘plotTopoMap’ function ? I can’t find this function in tips. Thank you a lot!
Hello Professor Cui, I used the complete link to xjview that you provided in the comments, intending to perform a GLM analysis. However, the downloaded files do not contain the ‘glm.m’ script. Could you please specify which script in your xjView is used for GLM analysis?
Please go to: https://www.alivelearn.net/?p=1574
Thank you very much! But I have checked the files in this download package, and there are no glm.m, plotTopomap.m functions。。
plotTopomap can be found at
https://www.alivelearn.net/?p=1300
Dear Professor Xu,
In your group analysis, you used c = beta(:,1) – beta(:,2) to represent the difference in effects between two conditions. I would like to clarify whether you assumed there is only one channel, or if you compared the differences in all channels between different conditions to determine the effects of different conditions on the entire brain (covering areas where sources and detectors are placed). If I want to understand the differential effects of different conditions on each subject across every channel, should I modify the mentioned code to c = beta(i,1) – beta(i,2)? Furthermore, if I have M conditions and N channels, should each subject’s contrast result be N * (M!/(M!*(M-2)!))? Is this understanding correct?
sorry,N * (M!/(2!*(M-2)!))
the contrast is for one channel of one subject; you calculate contrast for each channel and subject, then do group analysis
Thank you very much for your explanation
Professor Cui,
I have checked this link:https://www.alivelearn.net/?p=1574.But there is no script named “glm.m”OR”onesampleT.m” .Could you send me the copy of those files? Thanks a lot